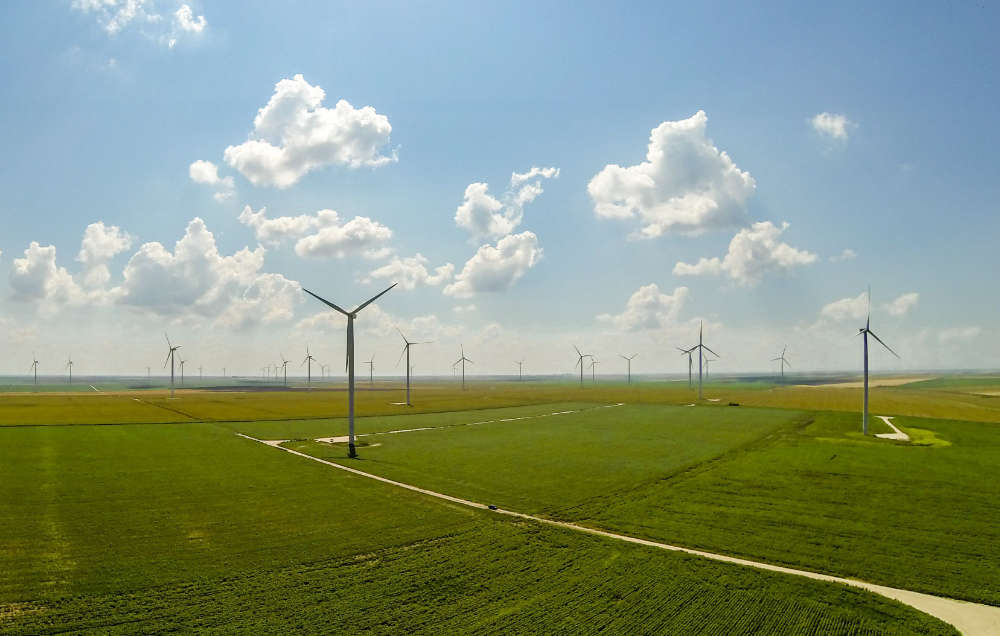
Over recent years the wind industry has seen continual stable declines in the Levelised Cost of Energy (LCOE), enabling it to lead the way in terms of renewable energy growth by 2020, with over 700GWs installed worldwide. While wind seeded the ‘top’ renewable spot to solar PV in 2020, it remains a key component of the renewables growth story both now and in the future.
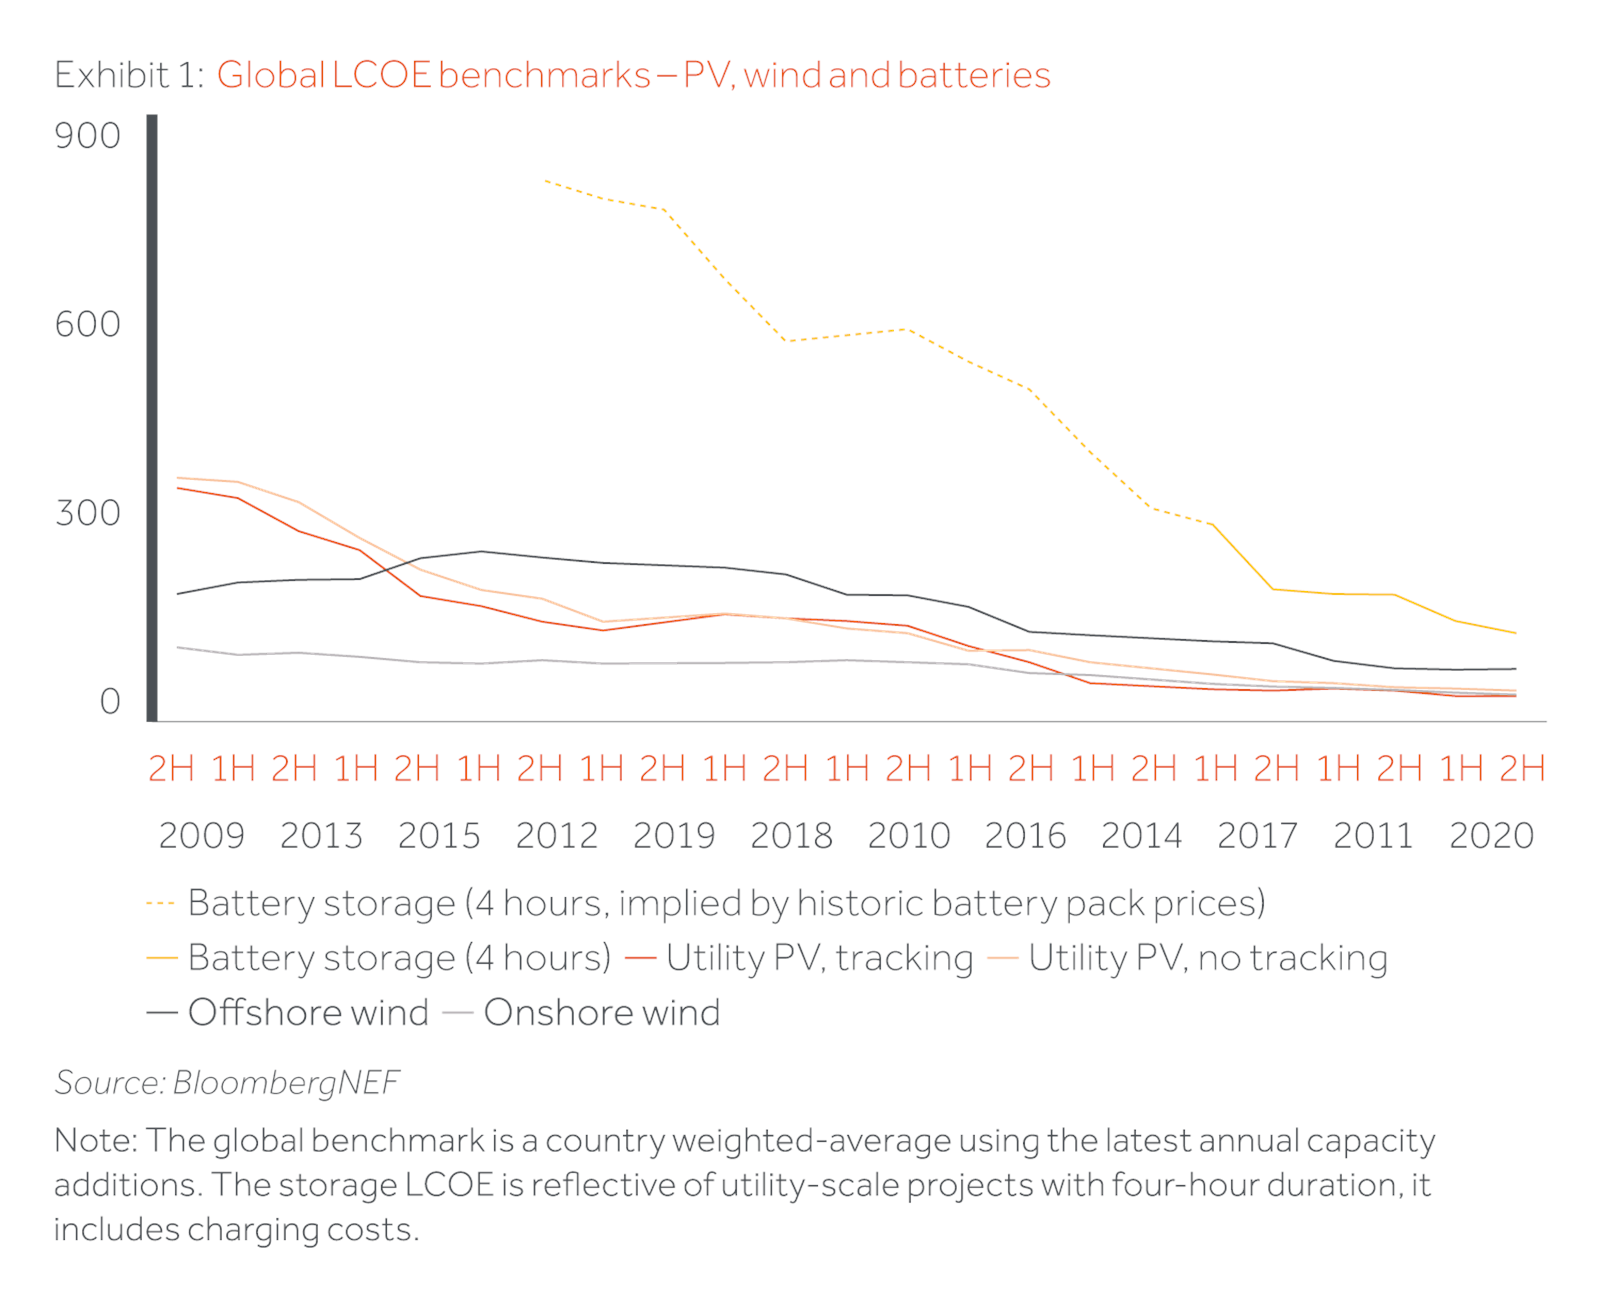
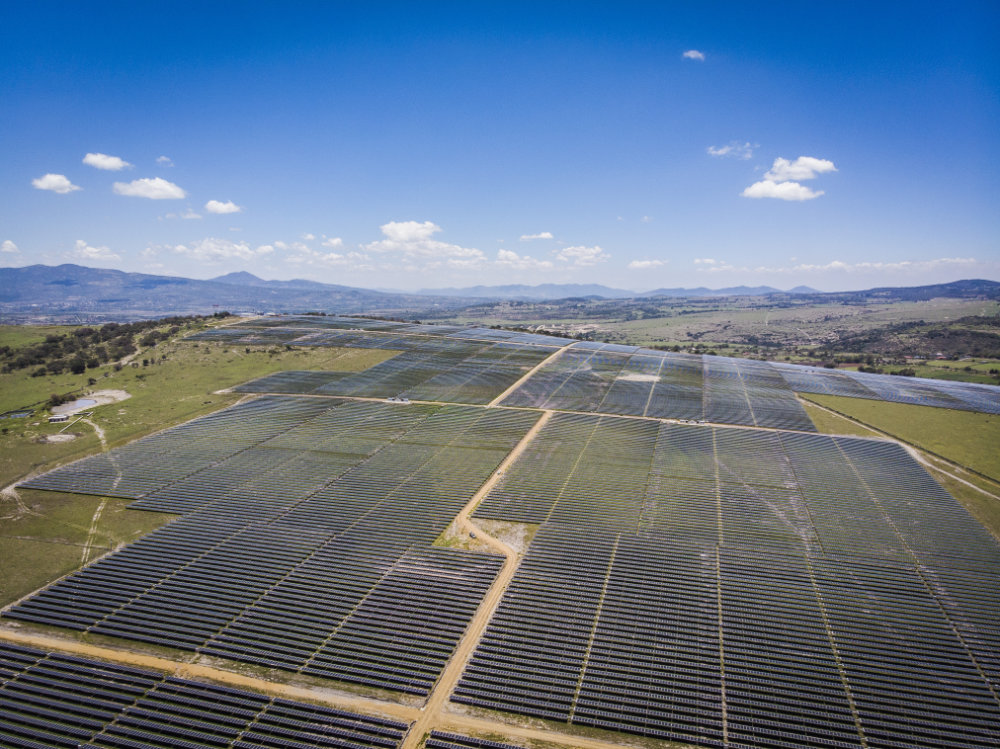
Wind growth to date has been driven mainly by increasing turbine sizes and improvements in the overall manufacturing efficiency, both enabled by economies of scale and incremental design improvements. With positive growth forecast continuing (60GW/yr to 2025), the overarching question for the industry as we look forward is, can this trend continue or could gains be undone by commodity price increases and supply / demand imbalances due to a consolidated supplier market. The question also arises as to whether wind energy can ‘keep up’ with solar power (which currently forecasts annual installations of 130GW – 140GW) and whether there are any technological leaps ahead which could drive a further stimulus to cost reductions and/or growth.
Big is better
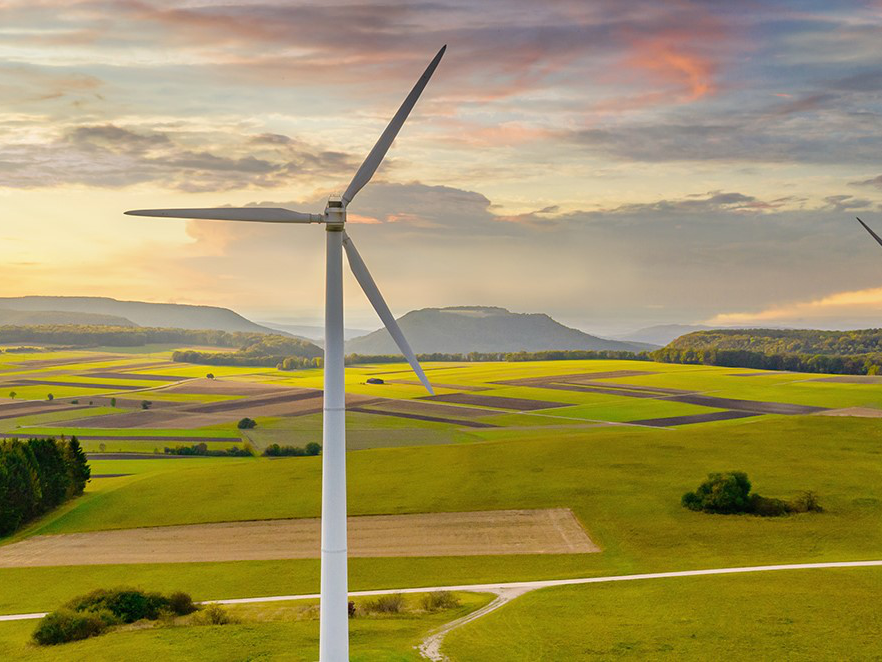
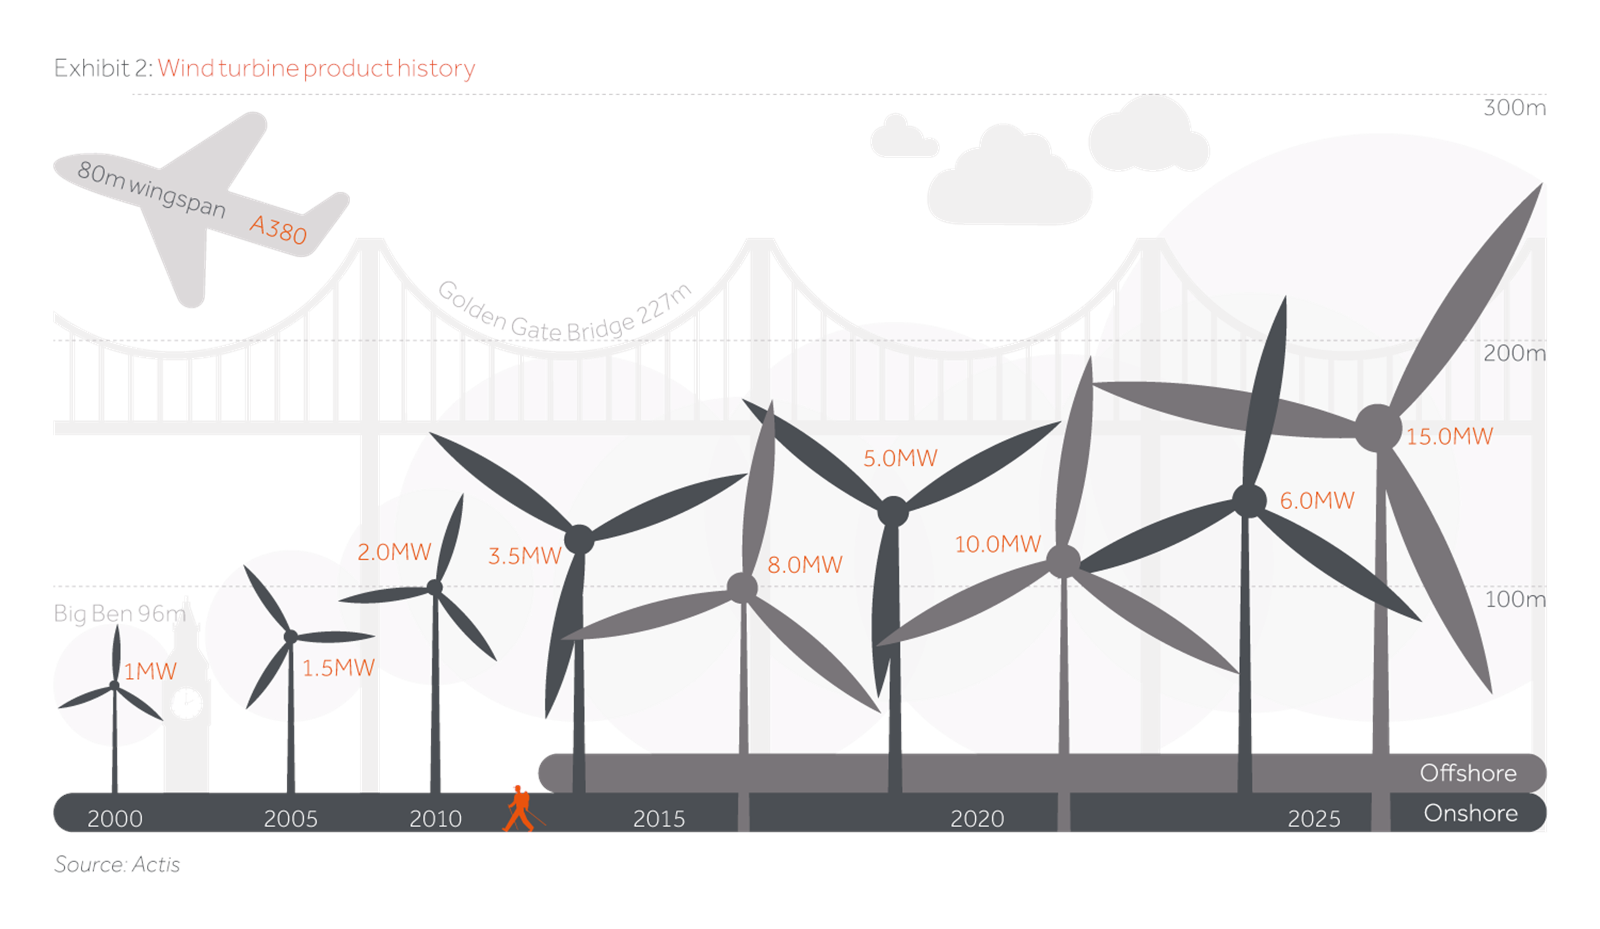
The energy generated by a turbine is a function of both the velocity of the wind (cubed) and the swept area of the blades. Remembering that area is πr2, blade length provides an exponentially higher increment in energy generation. To date, costs have tended to increase in more of a linear fashion with regards to scale increase, also benefitting from cost savings associated with foundations and cables. The growing spread between increasing yield and cost has led to a continuous reduction in the LCOE of wind. This has yielded onshore turbines with 4 – 6MW generators and blades of 70m+ and offshore turbines with 10MW generators and 100m+ blades.
But can this trend continue? Since the turn of the century and the introduction of the 2MW turbine platforms, predictions of a cost reduction plateau have proliferated. Limitations of road and crane infrastructure and the start of exponential cost increases have started to bite (as turbines get taller and blades longer thus increasing the amounts of steel and fibreglass required to hold up the structure). Despite credible arguments behind these limitations kicking in, improvements in logistics support including specialist trailers, blade lifting transport systems and increasing crane sizes, have been achieved. Improvements in material science have delivered continued growth of blade size at limited cost due to economies of scale, underwritten by continued strong growth of the sector.
We see further material potential for cost reduction which in turn supports installation growth. The investment that the suppliers have made in manufacturing facilities and limitations on some of the manufacturing processes required mean the immediate future focus turns to consolidating and improving onshore platforms. Increased modularity and the introduction of “split blades” could lead to another round of growth for onshore within this decade. In the offshore market, the lack of limitations around roads and transport will likely mean a continued march towards 20MW+ turbines. These all point to more power at still lower cost.
Offshore wind
In 2019, the offshore market crossed a critical threshold with the UK awarding 6GW of effectively subsidy free offshore wind PPAs. For both solar and onshore wind, the crossing of the unsubsidised threshold marked the beginning of exponential growth. Considering the growing need for green, diverse energy supplies, the same can be expected for the offshore market. Offshore wind will likely also benefit from ever increasing project scales and a need to have a more diverse and predictable generation profile to support the increasing penetration of onshore wind and solar, which will increase the ancillary costs of operating the grid.
Floating offshore wind
In 2020, offshore wind also saw construction start on the world’s largest floating off-shore project in Norway (88MW Hywind Tampen project). As the most optimal offshore site locations are taken, especially in shallow waters, project locations and thus the LCOE associated with projects will worsen. Floating offshore presents an opportunity for continued scale along-side improving wind regimes seen in deeper waters. As such, this marks a considerable milestone, which combined with the overall improvements in offshore project economics are expected to create an environment for increasing growth.
Modularity/ site specific WTGs
Wind projects have traditionally suffered from sub optimal turbine designs for project specific installations. Turbine design and manufacturing costs as well as product development timelines need to service a multitude of project sites across differing markets. We think this is changing. As turbines and economies of scale become larger, and supply chains more developed, specialised key variables such as height, blades and electronics become interchangeable. This delivers bespoke turbines better suited to a specific site, in turn improving economics. It is expected that this will be a trend that is initiated in the next few years.
Split blades
To mitigate the logistics issues caused by such large blades, a number of players have investigated split designs with onsite assembly. This is no easy task with fibreglass construction of rotating equipment and a design life of 25 years. However, with advancing materials science, deeper analytics and experience in composite construction several suppliers now see a path to near term release of a product, which could spark the next generation of increased sizing for on-shore products.
Smart blades
Turbine efficiency is invariably linked to the efficiency of the turbine blade in converting the winds kinetic energy into lift (and subsequently electrical energy). The optimal aerofoil shape however changes in differing wind speeds and turbulence, not to mention the need to survive in variable extreme environments. Materials, science and advance control systems may unlock the ability for blades to provide a limited quantum of adaptability to the wind environment that would ultimately lead to improved performance and flexibility.
Hydrogen
Offshore wind can also generate electricity that can be converted to hydrogen via electrolysis of seawater. Hydrogen has the advantage of being more easily transported and can be carried via existing gas pipelines rather than having to lay electrical cables. By converting electricity to hydrogen which is capable of being stored, it also addresses some of the issues of intermittency created by the fact that offshore wind is weather-dependent.
AI / smart controls
A considerable amount of loss is currently incurred due to wake effects and power curve inefficiencies. Smart systems offer an exciting opportunity to minimise such losses through a holistic, adaptive approach to a wind farms’ control systems. This may account for such losses and act to maximise generation of the wind farm as a whole rather than the specific turbine.
Summary
For a mature technology that already represents a leader in the energy space in terms of cost, growth, and climate credentials, the scope of further advances looks too good to be true. Challenges around competitiveness against solar (which offers an even lower cost point in many cases), increasing costs associated with addressing grid stability, a commodity price super cycle and decreasing viabilities of the incremental sites represent barriers which could mitigate explosive growth. We think these are all solvable and only represent minor limiting factors with the projected 60GW/yr growth projection to also coincide with continuing drops in cost. This positive technological environment in combination with the infinitely scalable solution represented by off-shore wind drives a positive growth story for the foreseeable future in wind. We also think, resource diversification means wind maintains an important role in the energy mix moving forward, no matter the price points achieved by solar.
A core assumption to any wind investment is ultimately, how much yield will be generated over the life of the asset. To predict this, sophisticated measurement and modelling are used to establish a long-term yield estimate. While impressive, there has been room for both human error and an over reliance on assumptions informed by historical values which are no longer valid in an ever changing technological environment, leading to material underperformance of some assets.
Energy Yield Assessments (EYAs)
An energy yield assessment attempts to assess the future performance of a plant and assigns a probability against achieving differing generation levels over differing periods. This is typically presented as the one year and the ten year P50 and P90 i.e. 50th and 90th percentile of performance over a measurement period.
All EYAs use measurements derived by meteorological masts (’met masts’), that gather data for a period of at least 12 months, but typically around three years. The site specific wind data is adjusted up or down based on correlation to long term meteorological data sets to provide confidence that the measured wind period is representative of longer term norms.
This data is then used to predict the wind speeds associated with the specific wind farm design. Once the wind speeds have been established, the turbine power curve and losses (availability, electrical losses, turbine under-performance etc.) are used to establish how much energy will be generated on a long-term basis.
The track record
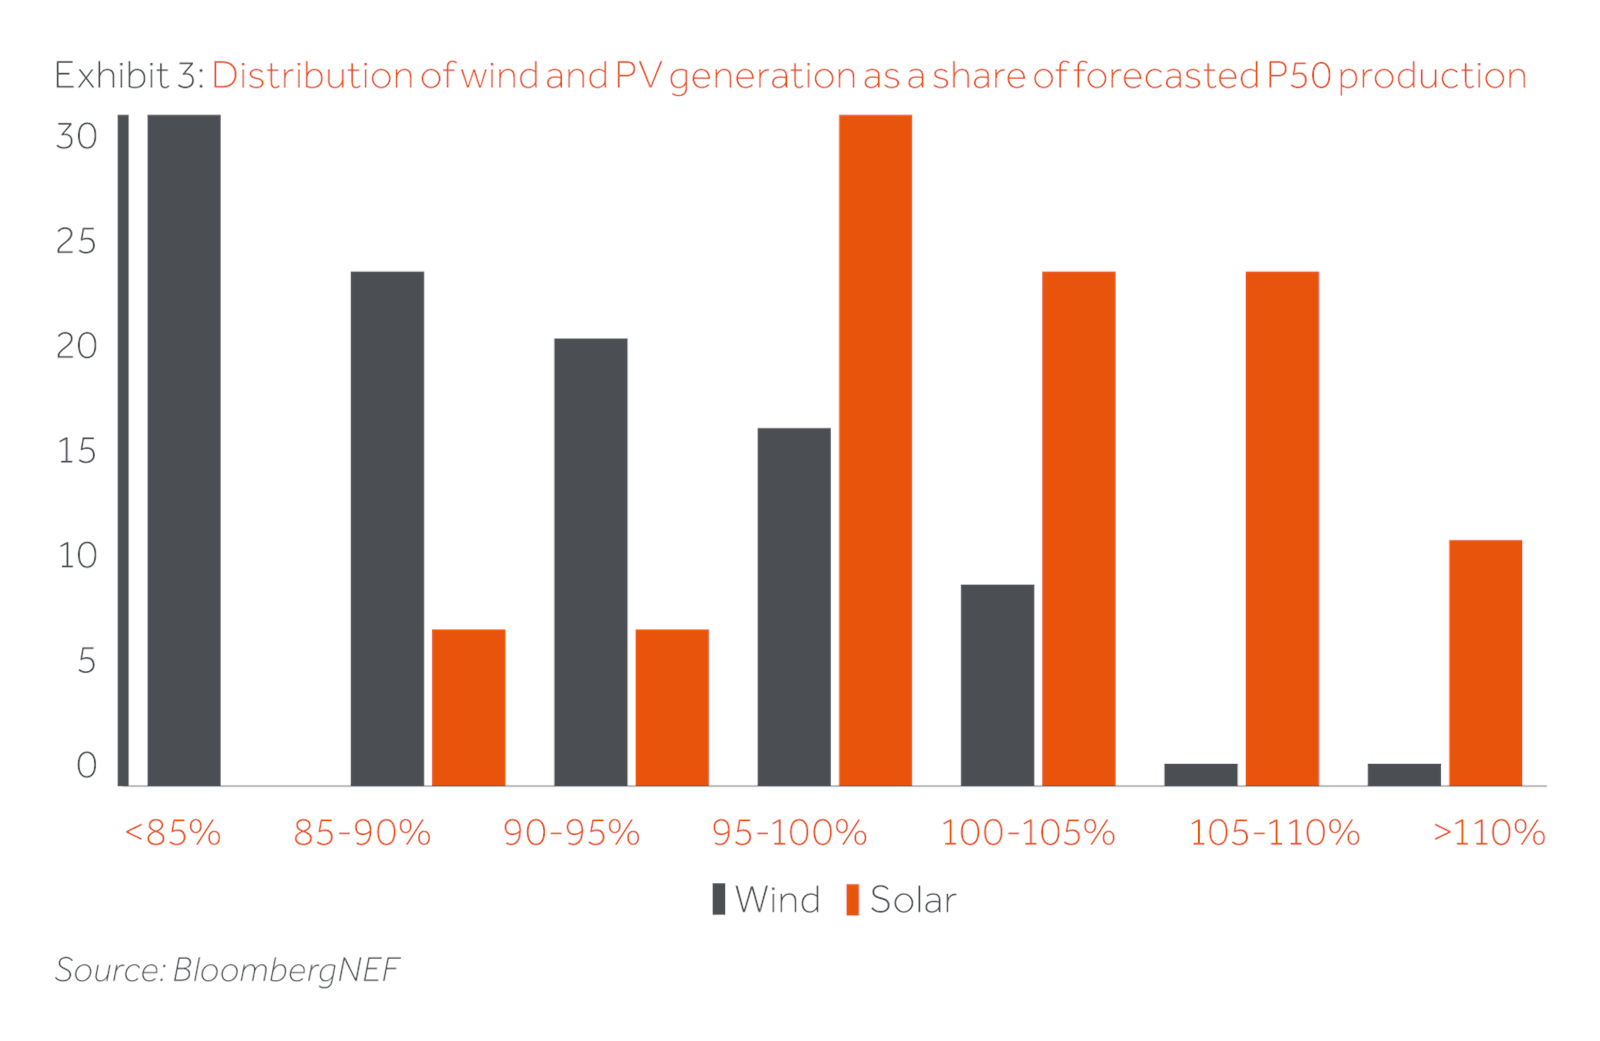
In 2020, BloombergNEF published a paper on Project Bonds for PV and Wind. Fitch Ratings agency is quoted as noting that “a decade of analysis shows that solar resources are consistently more stable and predictable than wind, resulting in less volatile revenues and generally higher ratings”. According to this research 89% of rated wind projects were performing below their predicted P50 generation levels.
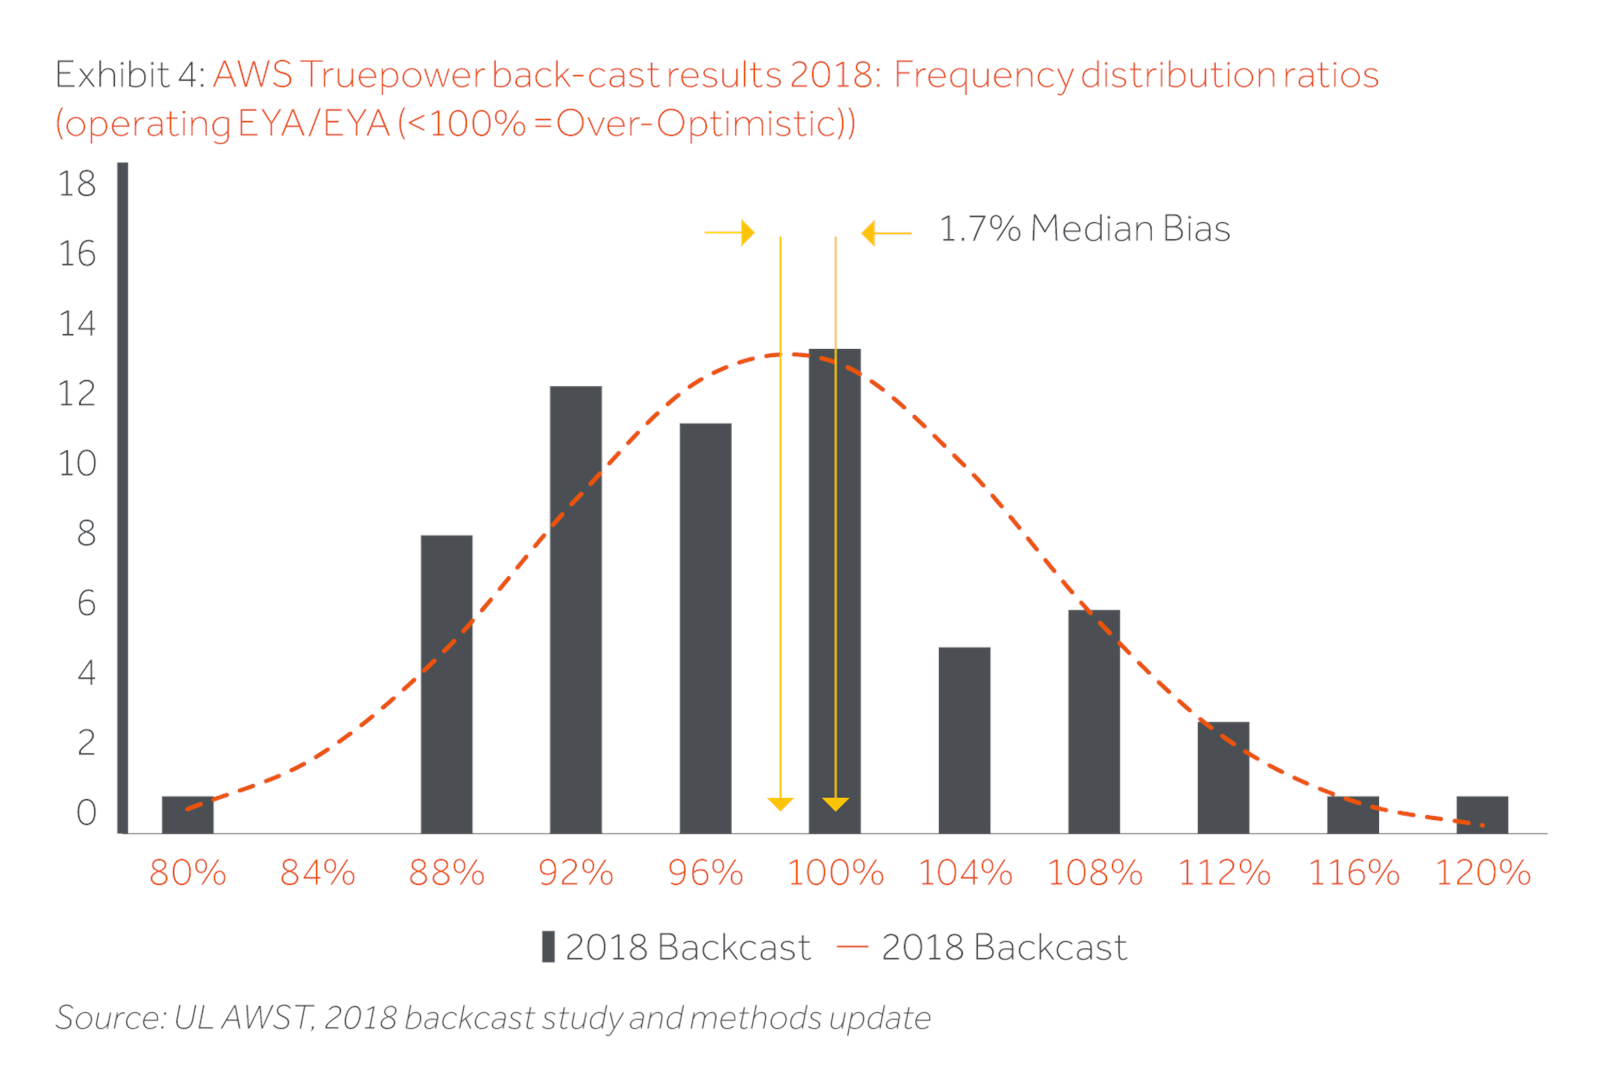
The leading EYA consultants periodically publish validation studies or “back-casts” where they review actuals against predictions. The picture is not favourable for the P50 (i.e. equity) results, with DNV GL publishing a 2019 study showing an average over estimation of 3.1%, with other such studies showing similar results: AWS Truepower 1.7% (2018 study), Natural Power 0.9% (2015 study) and K2 Management 2.8% (2015). The consultants behind these studies are often pointed to by developers as being ‘overly conservative’.
While c.2 – 3% error may not sound significant, one needs to consider that this will disproportionately impact the equity investor. Most wind farms are underwritten with c.70% leverage, i.e. a 3% over estimate will result in a c.10% hit to the cashflow to equity.
Room for improvement
While the current methodologies are impressive and significantly improved from their historic peers, the track record attests to the fact that they are far from infallible. So where do they fall down?
Firstly, this type of analysis is complex. There are common errors that tend to arise:
- Complex wind regimes (i.e. with variable terrain or the presence of broader thermal / geographic effects)
- Poor wind monitoring campaigns
- Inappropriate accounting for Power Curve performance extrapolation; and
- Inappropriate modelling and assumptions concerning wake effects (i.e. the slowdown in wind speeds caused by the interaction between wind turbines).
While these errors should follow a normal distribution with symmetric up and down side, the pressure from developers to recoup costs and realise development gains has resulted in bias within the market.
We can see that energy yields have been over optimistic on average. If the above common errors were controlled, energy yields would quickly fall into two broad spectrums. The first with a material risk of underperformance (see the “bump” at the under-performing end of the spectrum within the AWS Truepower data in Exhibit 4), and the other group that would be expected to follow a normal distribution.
The second factor at play here is that the methods themselves rely on back looking corrections. i.e. models are continually adapted to account for the introduction of new project characteristics and technologies which renders some previously valid modelling simplifications, invalid.
By reviewing the methodology adjustments to losses alone, one can see that between 2008 and today, DNV GL, widely recognised as one of the world’s leading technical authorities in wind power, has introduced updates which would see an identical asset have a P50 estimate today which is 4.2% lower than it would have been using the 2008 methodology.
Climate change
Climate change is a leading issue facing the EYAs which rely on historic, not predictive long term energy inputs. The increase in global temperatures and changing climate patterns are expected to alter wind patterns (noting that wind is ultimately thermally driven). Changing thermal distributions will drive higher wind in some areas and lower in others. While climate models are currently not sophisticated enough to allow for granular, project level adjustments to wind, risk factors can be identified and considered. Where the predicted regional climate patterns are not detrimental to the assets in question, the risk can be considered acceptable.
Looking forward
For a sophisticated investor, it is possible to accurately assess an assets’ generation profile, more so, on a portfolio basis. Through a combination of bias elimination, diversification and scale, yield risk can be managed to a level commensurate with the return profile of renewables.
The key is to understand what the EYA methodologies fail to accurately represent: risk. An artificially constructed probability curve of generation outcomes is not the same as risk. The constructed probability curves which have been developed have been based on computer models and manual adjustments which in turn have been based on a back looking view. The matching of risk against the proposed projects, is a fundamental step to accurately modelling the risk / reward of a project. Such adjustments need to account for these modelling issues plus take a forward look into the evolving technology.
“Unfortunately, at present, there is insufficient data and too many variables to support hard and fast risk algorithms to define a required increase in return from increased risk. Caution therefore needs to be taken and a large P50 / P90 spread should be used as a strong indication that either more work is needed to reduce the modelling risk to an acceptable level or conversely the required project return needs to be increased.”
The Actis approach
Unfortunately, at present there is no “silver bullet” approach to addressing risk-return. However, by diligently addressing the key areas of uncertainty and by appropriately pricing the risk, Actis has tackled many of these issues. Our approach is delivered through an embedded operations team which can translate the technical risk into commercial outcomes. The operations team is also able to leverage the experience of 6GW of track record in the delivery of wind assets;
- The best domain specialist (i.e. region, wind regime, source information etc.) is utilised to derive the energy yield assessments
- Assessments are aligned with our needs (rather than standardised theoretical or lender based approaches which may under value the risk to the equity investor in preference to applying consistent “off the shelf” methodologies)
- Challenge the assumptions and approach of advisors to provide an effective second opinion.
- Re-frame the analysis to enable scientifically based investment decisions to be taken
- Understand and outline the implicit risks associated with the analysis and explicitly communicate them to the deal team.
